
Zoom icon

Hope and Wellbeing Data (2016-2018)

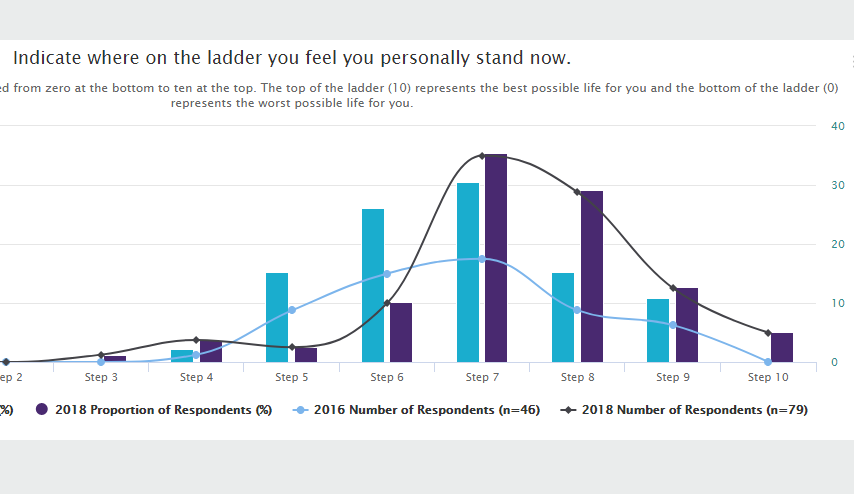
Across years, Vital Village has collected data using questions for the Hope and Wellbeing Survey as a part of our work with the 100 Million Healthier Lives initiative’s signature program: Spreading Community Accelerators through Learning and Evaluation (SCALE). Below are the results comparing 2016 and 2018 self-reported ratings.

March 15, 2019
Created with Highcharts 11.0.1Number of ResponsesResponse RateChart context menuIndicate where on the ladder you feel you personally stand now.Please imagine a ladder with steps numbered from zero at the bottom to ten at the top. The top of the ladder (10) represents the best​possible life for you and the bottom of the ladder (0) represents the worst possible life for you.2016 Proportion of Respondents (%)2018 Proportion of Respondents (%)2016 Number of Respondents (n=46)2018 Number of Respondents (n=79)Step 0Step 1Step 2Step 3Step 4Step 5Step 6Step 7Step 8Step 9Step 1008162432010203040Step 10​● 2016 Proportion of Respondents (%): 0​● 2018 Proportion of Respondents (%): 5.06​● 2016 Number of Respondents (n=46): 0​● 2018 Number of Respondents (n=79): 4​

‍

Created with Highcharts 11.0.1Number of ResponsesResponse RateChart context menuIn general, how would you rate your physical health?2016 Proportion of Respondents (%)2018 Proportion of Respondents (%)2016 Number of Respondents (n=47)2018 Number of Respondents (n=78)PoorFairGoodVery GoodExcellent010203040015304560Fair​● 2016 Proportion of Respondents (%): 21.28​● 2018 Proportion of Respondents (%): 6.41​● 2016 Number of Respondents (n=47): 10​● 2018 Number of Respondents (n=78): 5​
Get Involved

Your support makes a difference

Nurturing Leadership from the community, for the community