Data Dashboard Finds Sustenance in Community-led Data Workgroup
When the Vital Village Network was being created, the strategic planning team envisioned a publically-shared data dashboard that showcased relevant benchmarks for child wellbeing and existed as a tool for community engagement. Several months after launching the dashboard platform—Village Vital Signs—a community-driven workgroup began determining what data needs to be elevated by the dashboard and how that data should be collected, displayed, and accessed by the community. What’s more, this team worked on the ground, conducting outreach and brainstorming steps necessary to collect the relevant data and interpret it in a meaningful way. This workgroup came to fruition in the early fall of 2017, when a single interaction impacted one network member enough to catalyze new collaborations between community members and the process of data collection and analysis.
VVN member Suzeth Dunn-Dyer initiated the call to action after working with a 15 year-old mentee who was struggling with food insecurity. Suzeth knew that an abundance of resources existed in the greater Boston area related to food access, and yet she also knew that sometimes overwhelming barriers can prohibit families from accessing high quality, low-cost or free foods. After thinking deeply about how to address this issue, Suzeth and her husband, Patrick, decided to bring it to the network. Data coordinator, Futu Chen, opened the burgeoning data workgroup to this opportunity and a strong partnership emerged. The newly forming data workgroup became a space to co-design future data collection, analysis and presentation with VVN partners.
At the Food Access Workgroup’s inaugural meeting, the group of six discussed structural inequities contributing to food insecurity, negative stigma that hinders engagement with food resources, unacceptably low standards at some food pantries, and a vision of a future in which loved ones could feel empowered to easily find high quality, low-cost or free foods without shame. The group outlined the need for an interactive, user-friendly, easily-accessible resource that could be updated in real time to display reviews of different low-cost and free food resources. The group envisioned creating an app that would allow users to input a location and then find and review nearby food options, commenting on everything from the hours of operation to how respectfully the staff treated customers. Futu collaborated with the workgroup to tailor the vision of an app into something that could be incorporated onto VVN’s data dashboard, and came up with the goal of creating an interactive map with many of the aforementioned features.
Once the workgroup had a clear mission, members engaged in research and outreach to turn that vision into a reality. Members discussed the Food Access Workgroup at work, at church, at home, and in the community. They reached out to organizations across the city and beyond, learning from others’ experiences and meeting potential partners. The workgroup found that the Mayor’s Office of Food Access, in partnership with the Boston Public Health Commission, was finishing up a similar project. A meeting at City Hall led to a collaboration between the teams, and data that could be used to populate the map was generously shared with the workgroup. Futu also collected census data and worked with the team to determine the types of information that would be relevant to people in the community, and thus what to display on the map.
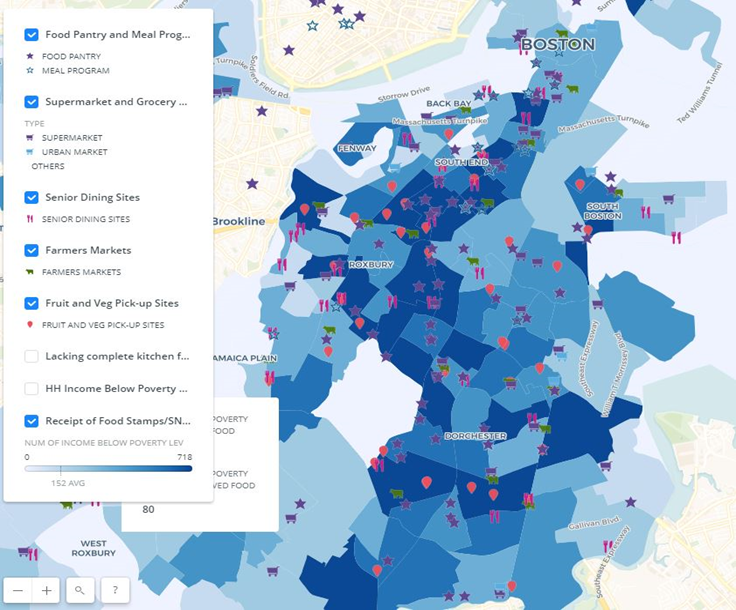
 The data dashboard now includes two new maps: one displays and describes all low-cost/free food resources, and another incorporates additional layers that show the percentage of households in an area receiving SNAP benefits or living below the poverty line. This information can be used by community members in search of food resources and to inform food vendors of neighborhoods that could benefit from low-cost or free food options. The dashboard also links to a website that tells the story of the workgroup, which you can read here. Since the data went live 5 weeks ago, the map has received 510 views and the data story has been read 254 times (November through December 2017). Members of the workgroup hope to expand the dashboard to include narratives and reviews of the resources highlighted, and will continue to work toward the creation of an app to combat food insecurity. Beyond food access, Vital Village will continue to create spaces for collaborative, community-driven data stories and analysis.

